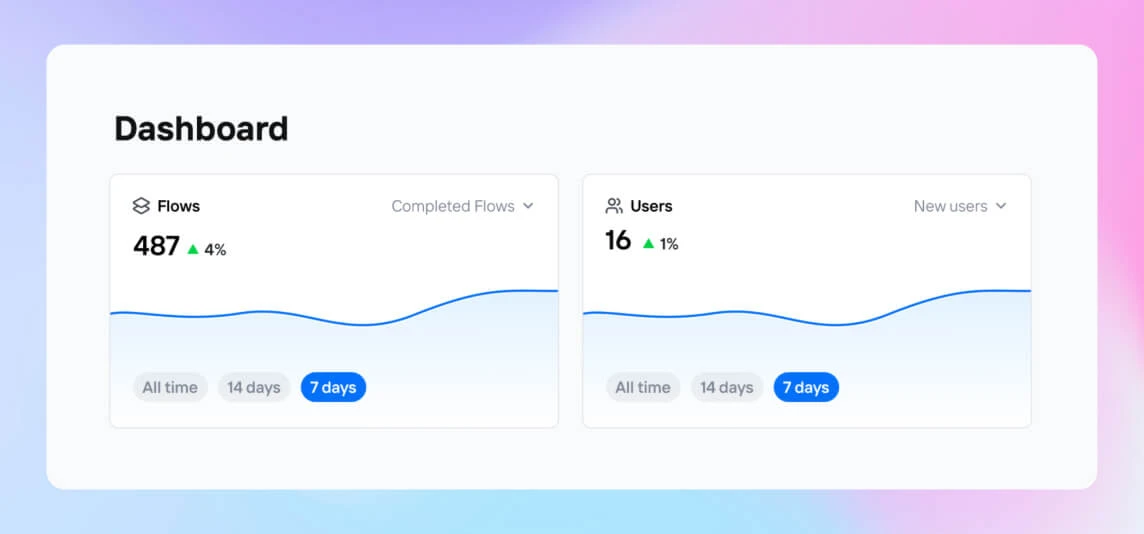
Dashboard Graph Upgrade
May 17, 2024
We've added more functionality to the graphs on the Frigade dashboard. Now you can easily toggle between different date ranges and see performance over time at a glance.
- Dec 12, 2023
Vanilla JS SDK Update
A few months ago we launched the Vanilla JavaScript SDK for any stack that runs JS (including Node). Since then, we've simplified the API and models based on feedback.
- Nov 7, 2023
Merging Guest and User Sessions
A common pattern in onboarding is letting a user complete a Flow before they register an account. Without help, this requires a custom datastore, cookie or local-storage juggling, and hundreds of lines of code to map guest data to the real user.
- Oct 25, 2023
Improved Docs Layouts
We've given the developer docs a layout upgrade. Rather than storing everything on a single page (it was getting out of hand), the docs are now divided into high-level sections to make it much easier to find what you're looking for.