Flow Analytics Previews

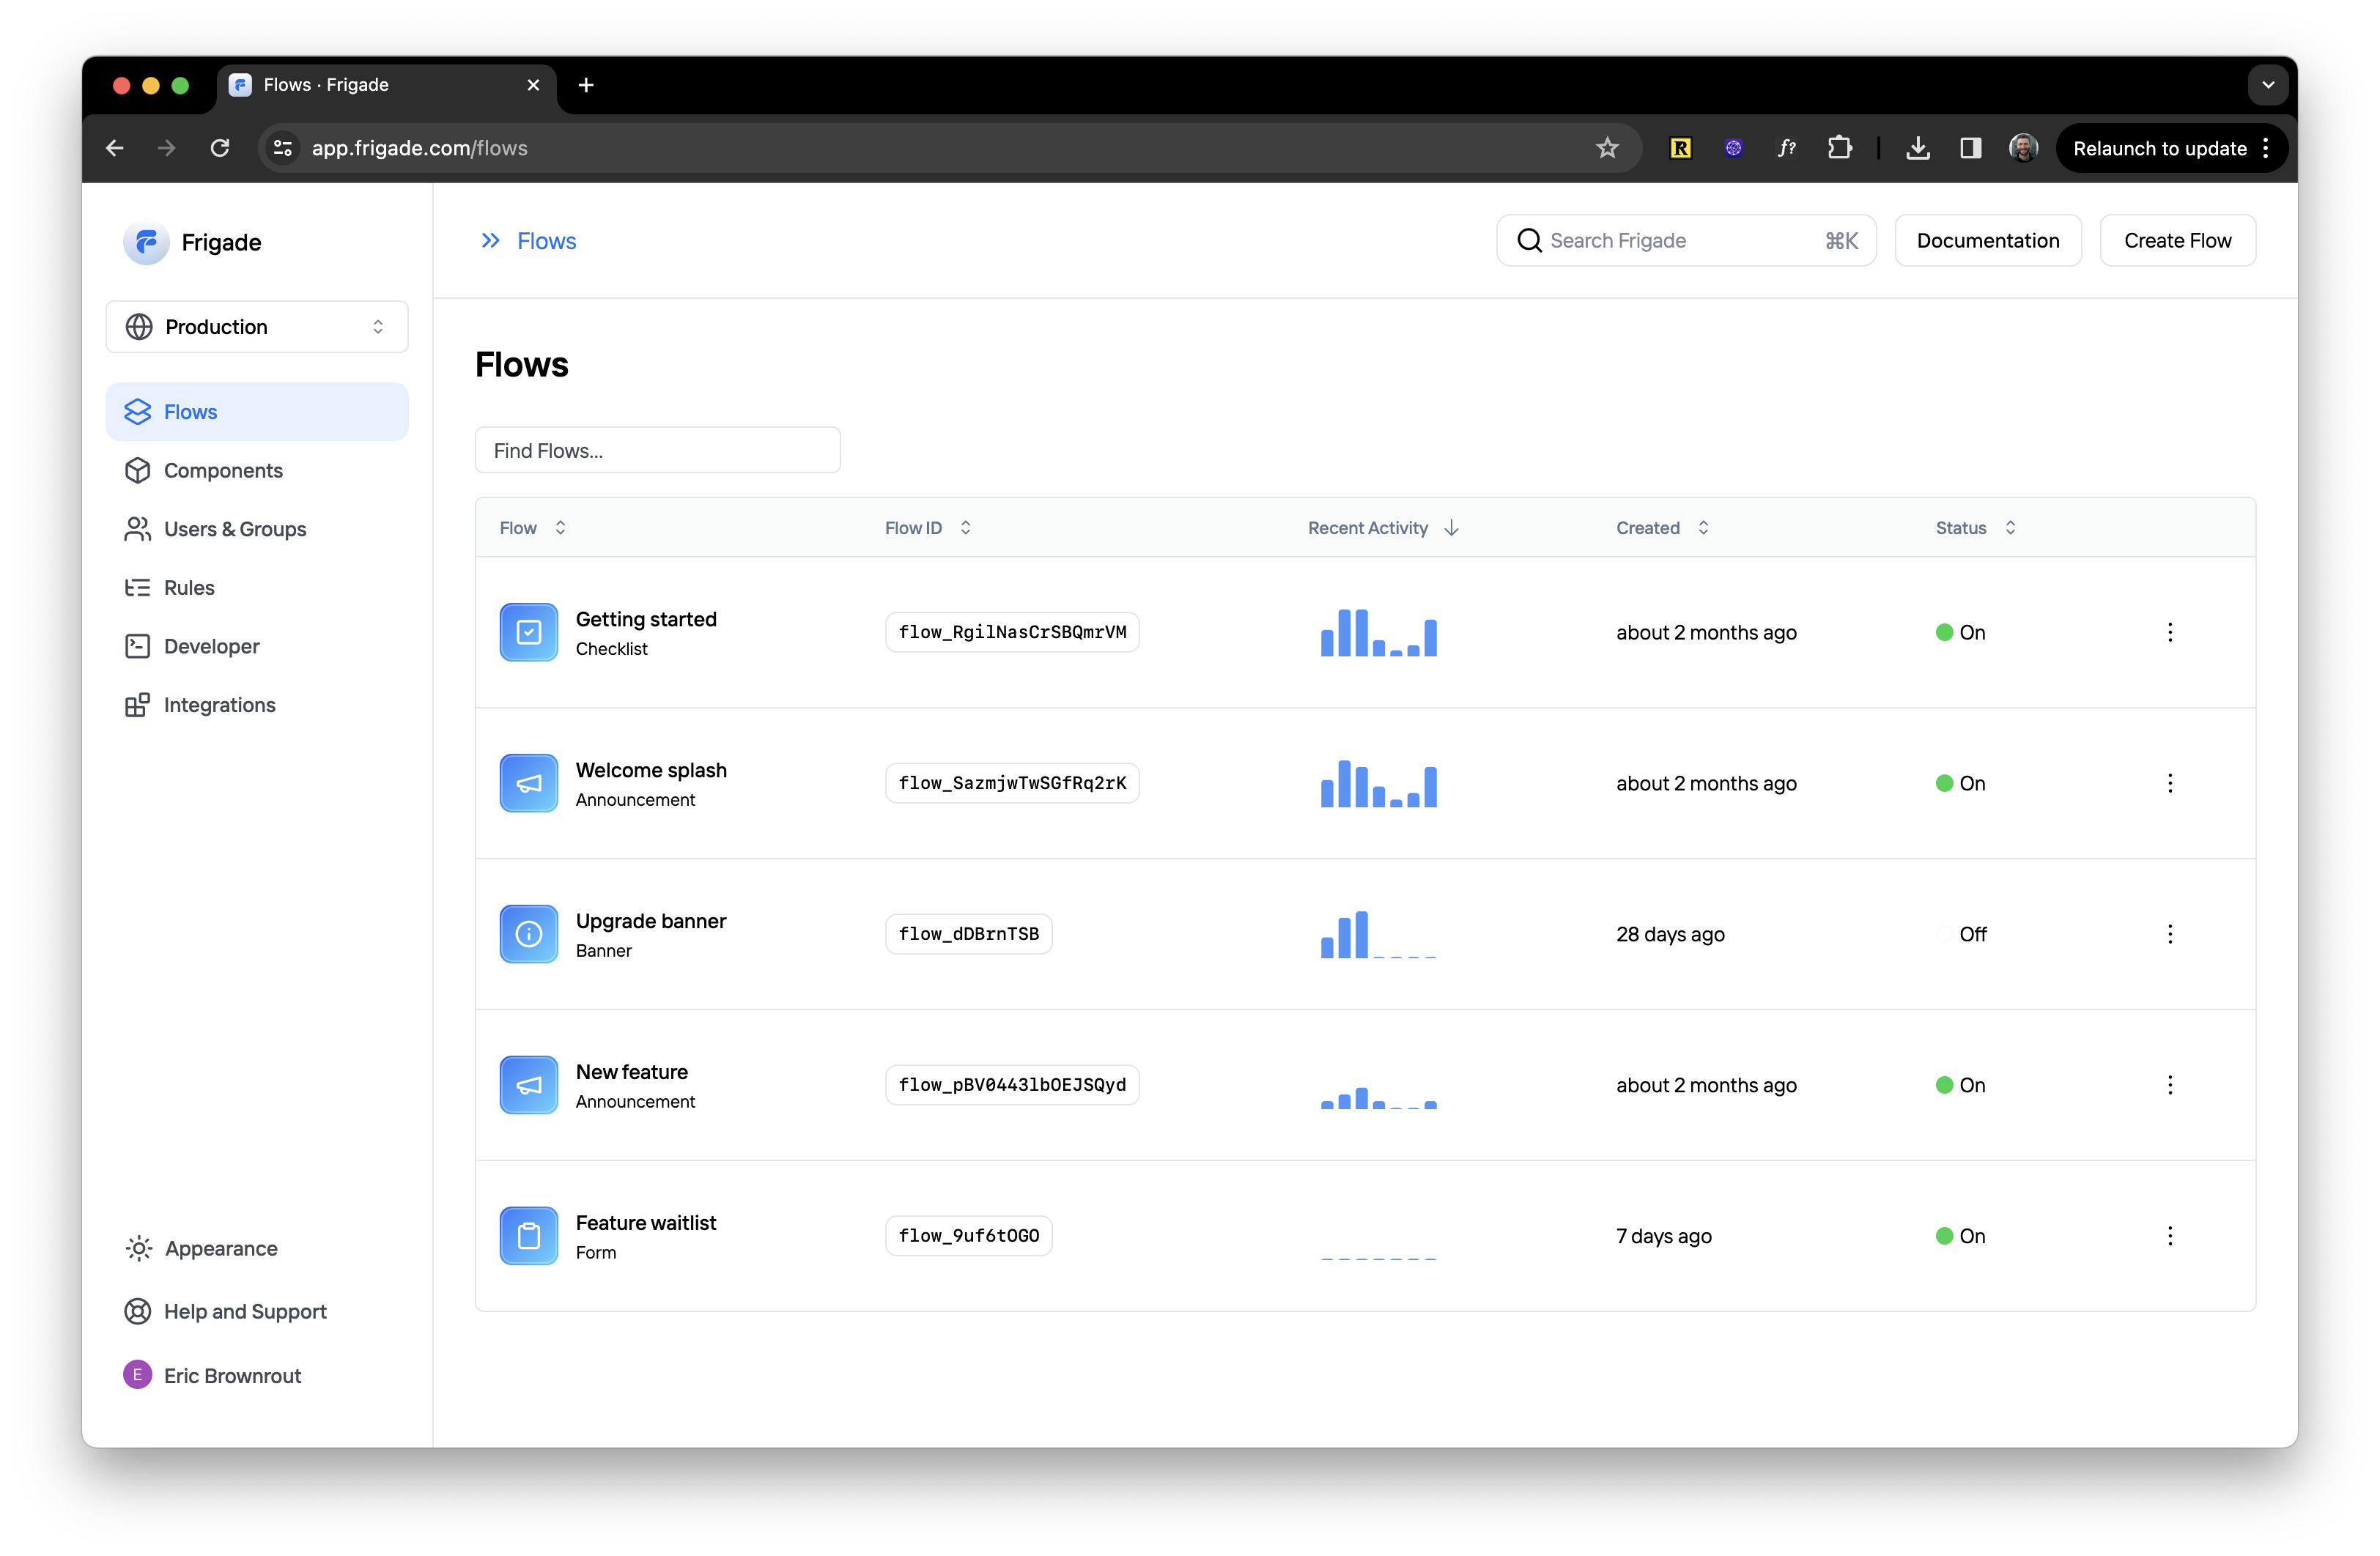
We've added activity graphs to the Flow table. Now, you can easily sort and see which Flows are getting the most traffic at a glance.
The graph shows the number of unique users in the last 7 days as well as the last time a user interacted with that Flow. Use it as a launching point to understand where the most engagement is, and then dive in to the Flow detail to get an even better sense of how it's performing.