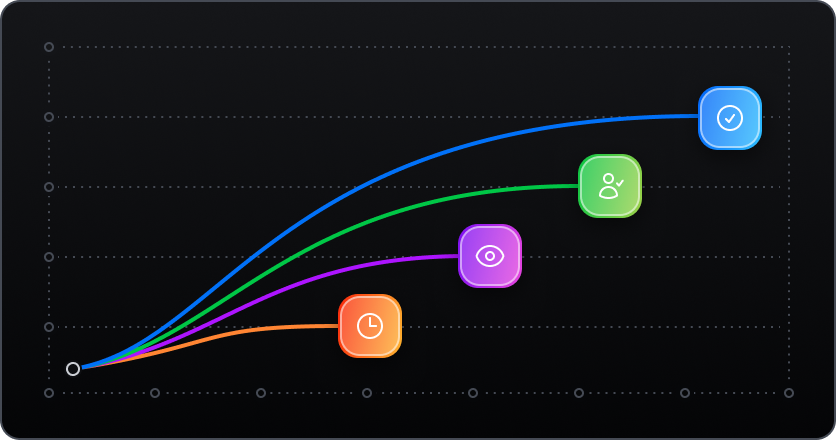
Updated Flow Analytics

Understanding how your onboarding and product education flows are performing is crucial to their success. After hearing feedback from Frigade users that they wanted better performance insights directly in the Frigade dashboard, we worked to give Frigade's Flow analytics a big update. Some of the new analytics features include:
- A new graph showing flow breakdowns for user seen, started and completed states along with overall completion rate.
- The ability to view performance over different blocks of time.
- Analytics on individual Flow Step performance which is particularly useful for checklists, tours, multiple step forms and more.
- Unique stats for each Flow version to understand how iterations have performed against each other.
And when more detailed analytics are needed, Frigade’s 3rd party analytics integrations for tools such as Posthog, Amplitude, Mixpanel, or Segment are available to be setup directly in the Frigade dashboard.
Check out the new Frigade Flow analytics in your Frigade Flows stats page now and let us know what you think!
